Ceph Mimic测试Dashboard功能

系统概述

Ceph从Luminous开始,提供了原生的Dashboard功能,通过Dashboard可以获取Ceph集群的各种状态信息;

相比之前的第三方实现,原生的Dashboard还比较简洁,但是部署和使用方便,后续值得期待!

Ceph从Mimic里实现了Dashboard V2版本,提供了更全面的Ceph展示和管理功能,值得一试;

下面基于Ceph:Mimic 13.2.1 版本实验下其Dashboard功能。

参考文档:

http://docs.ceph.com/docs/mimic/mgr/dashboard/

https://www.openattic.org/posts/ceph-manager-dashboard-v2/

注:Mimic 13.2.1还不支持非ssl的http访问,而最新Master版本里已经有非ssl的支持

操作步骤

按照官方文档的步骤,可以很轻松的部署起来Dashboard,如下:

1、查看ceph状态,找出active的mgr

1
2
3
4
5
6
7
8
9
10
11
12
13
14
15
16
root@ceph1:~# ceph -s
cluster:
id: cdd6456d-9291-4ec9-b138-e073aea1cdbe
health: HEALTH_OK

services:
mon: 3 daemons, quorum ceph1,ceph2,ceph3
mgr: ceph3(active), standbys: ceph1, ceph2
mds: kirkfs-2/2/2 up {0=mds-daemon-ceph3=up:active,1=mds-ceph3=up:active}, 6 up:standby
osd: 24 osds: 24 up, 24 in

data:
pools: 2 pools, 1536 pgs
objects: 25.64 k objects, 100 GiB
usage: 280 GiB used, 68 TiB / 68 TiB avail
pgs: 1536 active+clean

mgr: ceph3(active)

2、生成并安装自签名的证书

1
2
root@ceph1:~# ceph dashboard create-self-signed-cert
Self-signed certificate created

3、生成key pair,并配置给ceph mgr

1
2
3
4
5
6
7
8
9
10
11
12
13
14
15
16
root@ceph1:~/yangguanjun# mkdir mgr-dashboard
root@ceph1:~/yangguanjun# cd mgr-dashboard/
root@ceph1:~/yangguanjun/mgr-dashboard# openssl req -new -nodes -x509 \
> -subj "/O=IT/CN=ceph-mgr-dashboard" -days 3650 \
> -keyout dashboard.key -out dashboard.crt -extensions v3_ca
Generating a 2048 bit RSA private key
.......................+++
............+++
writing new private key to 'dashboard.key'
-----

root@ceph1:~/yangguanjun/mgr-dashboard# ls
dashboard.crt dashboard.key

root@ceph1:~/yangguanjun/mgr-dashboard# ceph mgr module disable dashboard
root@ceph1:~/yangguanjun/mgr-dashboard# ceph mgr module enable dashboard

4、在ceph active mgr上配置server addr和port

若使用默认的8443端口,则可跳过该步骤!

1
2
3
4
5
6
7
8
root@ceph3:~# ceph config set mgr mgr/dashboard/server_addr 192.168.0.26
root@ceph3:~# ceph config set mgr mgr/dashboard/server_port 8080


root@ceph3:~# ceph mgr services
{
"dashboard": "https://192.168.0.26:8080/",
}

5、生成登陆认证的用户名和密码

1
2
3

root@ceph1:~/yangguanjun/mgr-dashboard# ceph dashboard set-login-credentials admin admin@2018
Username and password updated

6、若需通过外网访问,则在有外网IP的机器上配置nginx服务做https转发

1
2
3
4
5
6
7
8
9
10
11
12
13
14
15
16
17
18
19
20
21
root@ceph1:/etc/nginx/ssr# scp ceph1:~/yangguanjun/mgr-dashboard/* ./
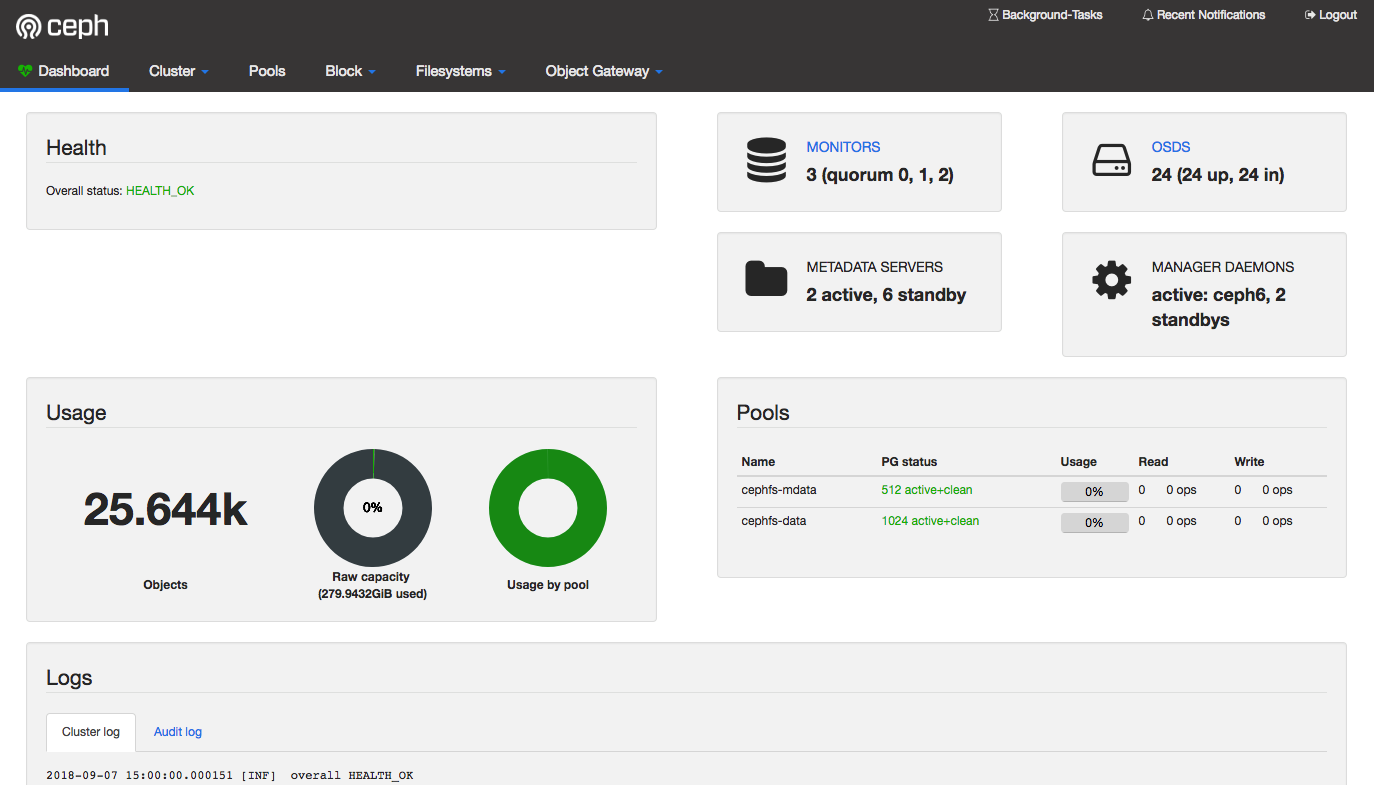
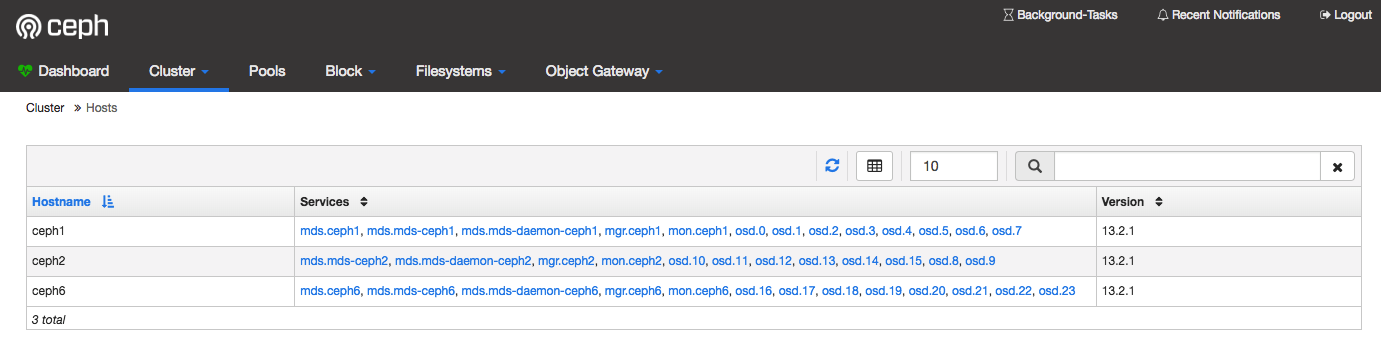
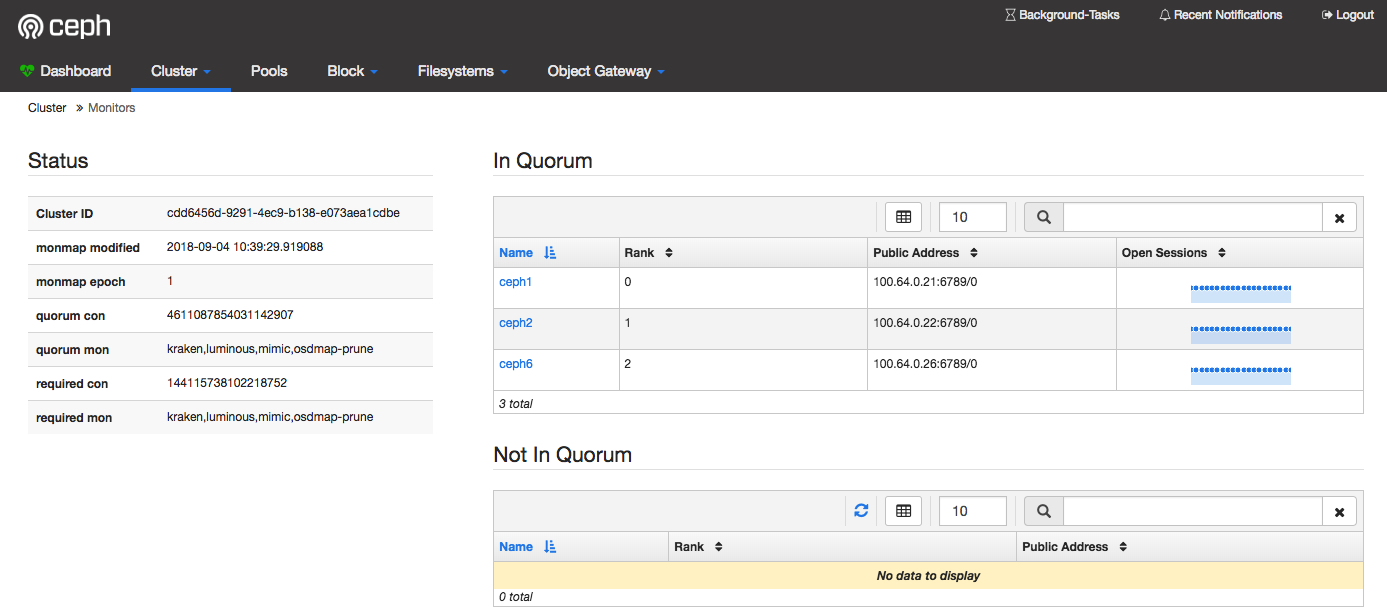
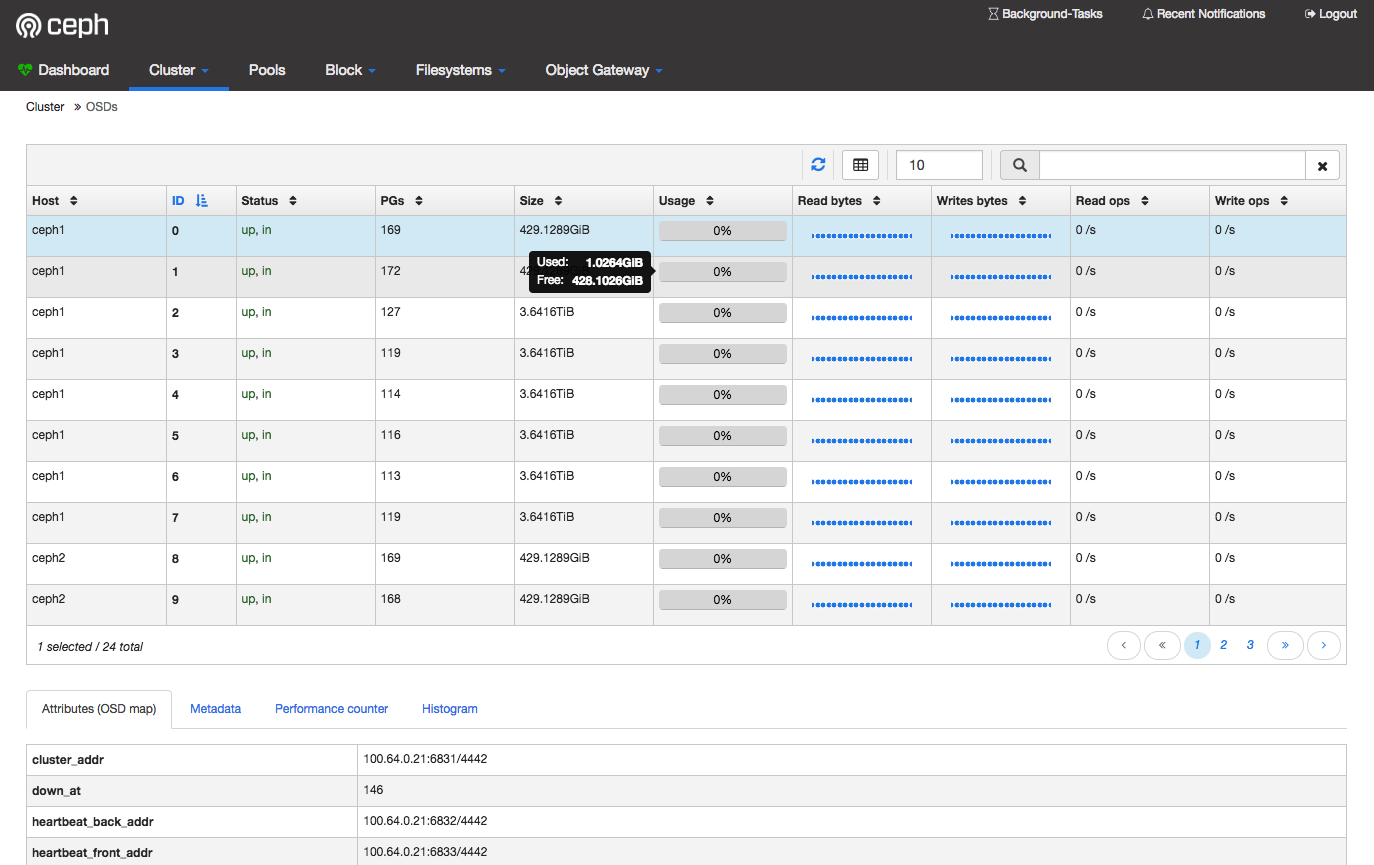
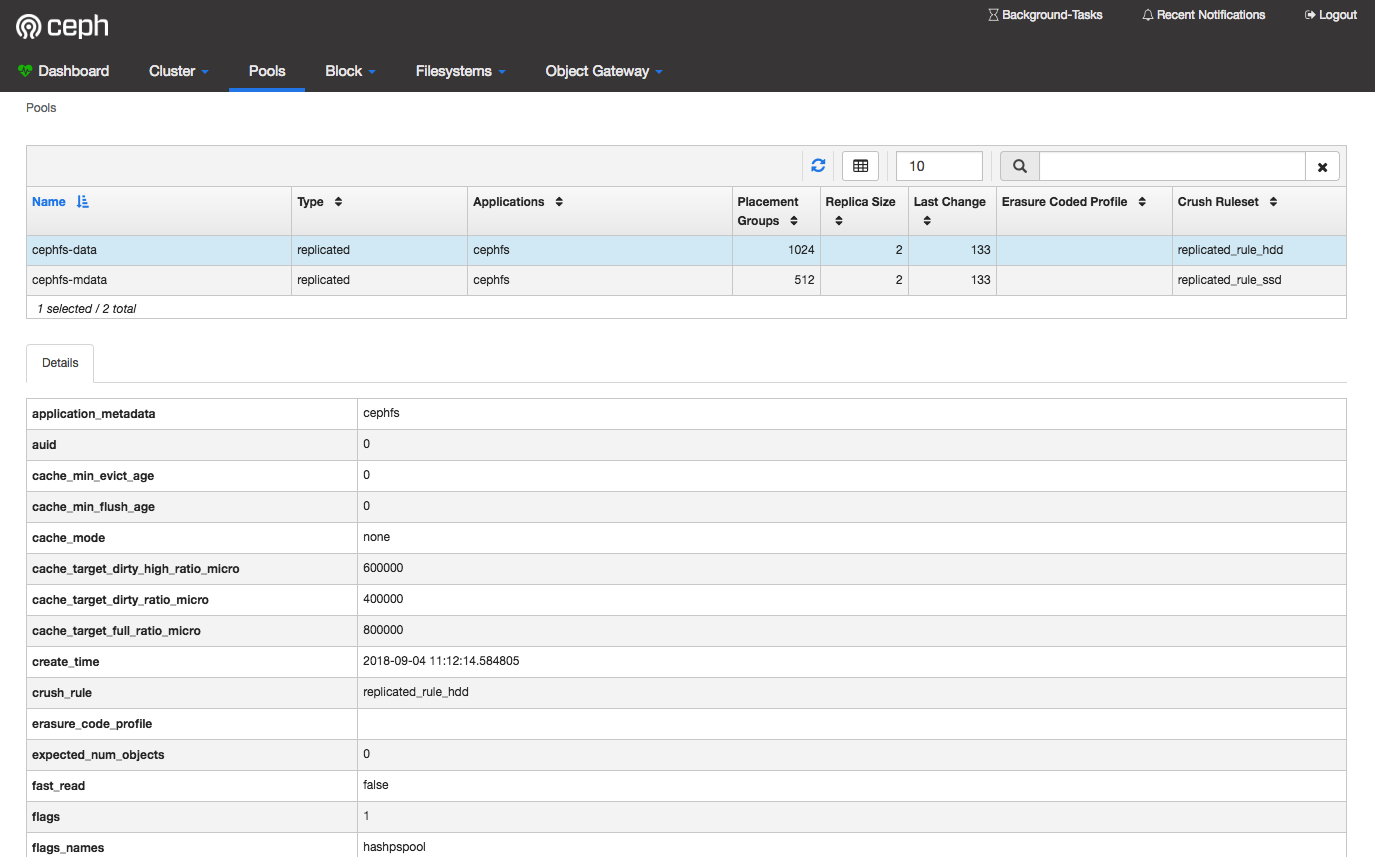
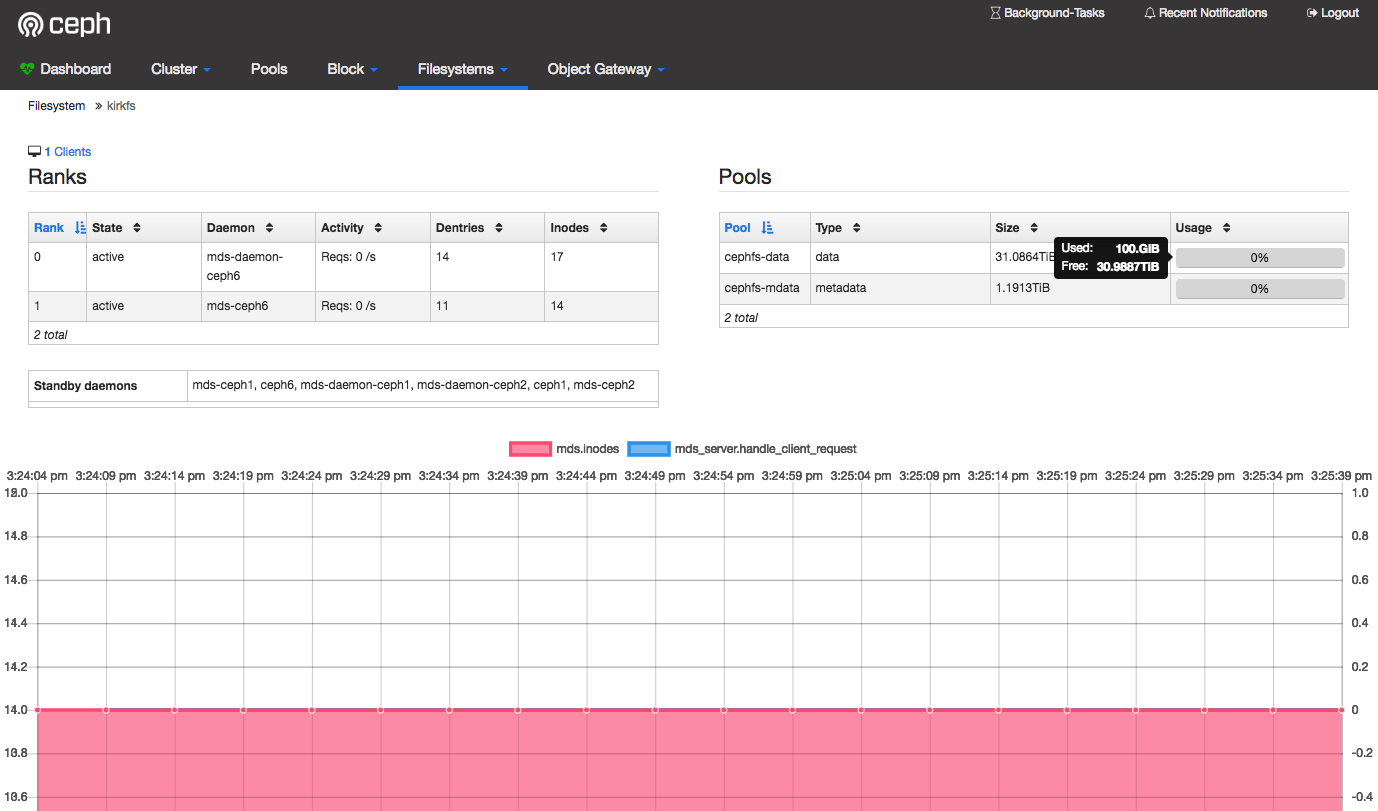
dashboard.crt 100% 1155 1.1KB/s 00:00
dashboard.key
root@ceph1:/etc/nginx/ssl# vim /etc/nginx/nginx.conf
...
server {
listen 8080 ssl;
ssl_certificate /etc/nginx/ssl/dashboard.crt;
ssl_certificate_key /etc/nginx/ssl/dashboard.key;
ssl_session_cache shared:SSL:1m;
ssl_session_timeout 5m;
ssl_protocols SSLv2 SSLv3 TLSv1.2;
ssl_ciphers HIGH:!aNULL:!MD5;
ssl_prefer_server_ciphers on;
location / {
proxy_pass https://192.168.0.26:8080;
proxy_set_header Host $host;
}
}
...
root@ceph1:/etc/nginx/ssl# systemctl restart nginx.service

示例截图

然后就可以通过ceph1的外网IP来访问ceph的dashboard了;

https://external-ip:8080/

使用之前配置的admin账号密码登陆后,看到Dashboard界面如下,然后截图几个,展示一下:

cluster

host

monitor

osd

pool

cephfs

支持原创